Measuring marketing ROI
Data-driven marketers depend on key metrics to measure the effectiveness of their campaigns on a daily basis. From fixing the right marketing budget to calculating the resources needed, from tracking campaign performances to measuring results against benchmarks, there are several KPIs for marketing teams to keep up with. Marketing leaders typically use these same metrics to report to their business stakeholders in order to align with the overall business performance.
Updated on Jun 26, 2020
However, business leaders often pose pressing questions about the actual business growth that is influenced by marketing. They would like to measure the real impact of marketing investments for their business. What they want is a clear picture of the Return On Investment (ROI) in order to make future decisions. They need a few easy to understand metrics to help with their decision making process.
The good news is that more than 70% of marketers are already measuring ROI in some form or the other. However, calculating ROI in the wrong way often misleads decision makers. In fact, according to a LinkedIn survey, ROI has been one of the most difficult metrics to calculate and depend on. Let’s look at the most commonly used formulas and metrics to measure ROI, the challenges brought by the current approaches, and discuss the ways marketers can better measure ROI.
Calculating the Marketing ROI
Marketing ROI has a simple formula.
% ROI = (Revenue generated from marketing / marketing spend ) x 100
You just need to find the aggregate revenue generated from your campaigns and divide it by the total marketing spend. However the devil is in the details—calculating revenue generated solely by your marketing efforts is not as straightforward as it looks. You will need to crunch multiple metrics from different platforms to calculate it as accurately as possible. ROI values for individual personalizations and campaigns are more difficult to track. You need to derive different methods and formulas from the above basic formula to create a few dependable metrics to report your ROI. Knowing which ROI metrics to depend on is just one of the challenges marketing teams are facing.
ROI Challenges for Marketers
There are several challenges typically faced by marketers while measuring their ROI:
- Data trust issues: Lack of data to analyze and the need to depend on multiple sources to collect data
- Measuring too soon: Calculating ROI way before the sales cycle is complete due to the increasing pressure to show value and proof of performance
- Too many metrics: Dependency on multiple metrics to derive exact ROI figures
- Omission of key metrics: Missing important metrics leading to a faulty ROI
- Complexity problem: Having hundreds of campaigns and personalizations running simultaneously on different channels
- The wrong approach: Not knowing the best way to calculate ROI for your business
At Insider, we understand the importance of measuring ROI for marketing teams, especially in industries like eCommerce where hundreds of personalization campaigns run at the same time. This is why we have introduced a new ROI Executive Summary Dashboard to equip you with a data-driven approach to maximize ROI for all your marketing personalization campaigns.
ROI Executive Summary Dashboard: A Sneak Peek
Our product team talked to our customer success managers to understand the most common problems faced by our partners and created a Minimum Viable Product (MVP). Later on, we interviewed our partners across industries to understand the key metrics tracked and differences in ROI approaches to validate our initial prototype. The team even ran a few A/B tests among different variations to cross-validate the ideas with our partners and customer success team. Combining research findings with the initial prototype and our extensive product experience, we’ve come up with a single-view dashboard to help you track all your key ROI-metrics in one place.

As a start, we enabled ROI tracking for our web and mobile web products because ROI is the most difficult to quantify for onsite personalizations. We’ve put together different ROI metrics for both A/B testing and 100% personalization campaigns.
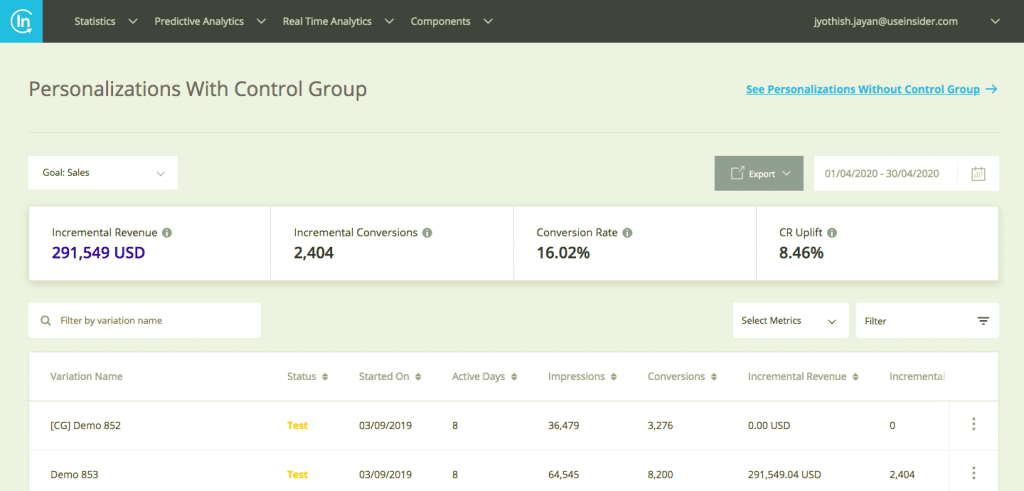
For A/B testing campaigns, the following are the key ROI metrics:
- Incremental Revenue: Extra revenue from personalization campaigns versus control group
- Incremental Conversions: Extra conversions from personalization campaigns versus control group
- Conversion Rate Uplift: The difference in conversion rates between the test group and the control group
- AOV Uplift: The difference in average order value between the test group and the control group
- Significance: Expressed as a percentage, it shows whether a campaign or personalization is reliable to take an action depending on the impressions or uplift

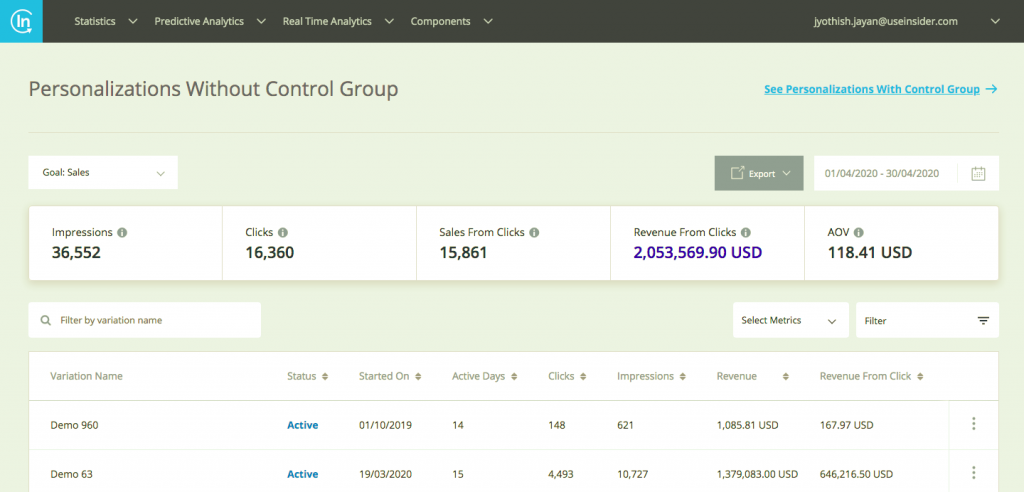
In 100% personalization scenarios, you can track the following metrics:
- Impression: Total number of views generated by personalization campaigns
- Clicks: Total clicks generated by personalization campaigns
- Sales from clicks: Sales numbers generated from campaign clicks
- Revenue from clicks: The total revenue generated from campaign clicks
- Average Order Value: The revenue generated divided by the total number of orders

These metrics were selected and put together along with well-researched and tested formulas in the backend to provide you with accurate and real-time ROI data. Now let’s see the main features of the new dashboard and how you can track your ROI.
Tracking ROI & Key Features
Currently, the dashboard is enabled to track all your web and mobile web personalization campaigns, with or without control groups. The metrics are shown in a much easier format that even external business executives can understand and depend on it for decision-making. The main features of the dashboard are:
- Tracking Campaign & Overall ROI
You can track your overall and campaign level ROI metrics from a split summary view of personalizations.
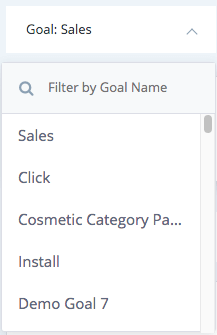
- Goal-Based Tracking
You can select personalizations based on different goals such as clicks, sales, engagement, add to cart, pageview, sales from clicks, or custom-goals and view the corresponding ROI metrics.

- Filtering Campaigns
You can filter out the personalizations based on status, goals, channels, products, significance, impressions and variation names. This enables you to select/deselect campaigns based on your filter criteria and view corresponding ROI metrics.
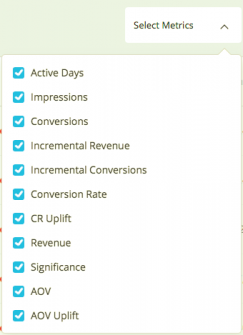
- Columns Metric Selection
If you want to focus only on a few key ROI metrics (say incremental revenue), you have the option to select/deselect key metrics for displaying as columns in your campaign ROI tracking dashboard.

- Redirecting to Individual Statistics
Simply click on the statistics button for every personalization to view the corresponding individual campaign statistics. This is useful when you need to investigate why a particular campaign is giving you higher/lower ROI and act accordingly.
- Exporting ROI Statistics
With a single click, you can export all your ROI analytics as reports to share it externally with business stakeholders and decision-makers.
Let’s now discuss a few ways in which your marketing team can make use of ROI-tracking for business growth.
How to Make Use of the Executive ROI Summary Dashboard
ROI summary metrics are useful for many powerful applications; few use-cases are highlighted below:
- Boost Your A/B Testing With ROI Tracking
Using the A/B individual campaign view, you can now check how your A/B tests are performing with the much needed real-time ROI tracking. So next time, you can use those variations that will maximize your ROI.
- Measure the True Value of Your Goals
You might want to know what’s the real value of the goal or may want to investigate further to check whether a secondary goal was crucial in hitting the primary goal. You can make use of the goal selection option to know which goals are contributing or not contributing to your ROI.
- Know Which Products or Channels Are Contributing Maximum ROI
If you are using multiple products of Insider, you can apply the product or channel filter to know which products/channels contribute to maximizing your ROI. For example, you can check how your mobile web personalizations are performing vis-a-vis desktop personalizations and decide where to invest in the future or take corrective measures.
- Identifying and Optimizing on the Winning Campaign
With multiple campaigns running simultaneously, it gets difficult to spot the campaign that might be contributing the most to your hero metrics like incremental revenue, incremental conversion, to name a few. You can filter out or group together a few personalization campaigns to pick the winning combination or single out the winning campaign and focus your efforts on campaigns that would boost your ROI.
- Report ROI to Business Stakeholders
Make use of the export statistics option to create ready to use ROI-reports and share with the concerned business decision-makers as needed.
Roadmap for the Future
Our ROI dashboard is ready to be leveraged for your on-site personalization campaigns. We will add custom-goal tracking for on-site personalizations in the coming days. We are also working on adding channel and product based ROI tracking and have already identified web push, email and recommendation channels as immediate priorities. Excited? Stay tuned and watch out for our latest updates.
Why Should You Try
Proving marketing ROI is a complex task and a marketer who understands what is contributing or not contributing to the uplift of ROI is definitely going to stand out. By measuring your Return On Investment, you ensure that the time, effort, and money invested in your marketing campaigns pay off. From now on, we hope our new ROI tracker will be your go-to dashboard to optimize your growth marketing efforts.
If you are an existing Insider partner, please check your panel for the new dashboard feature banner. If you are not a partner yet, you can request a demo of our platform to start tracking your ROI.


